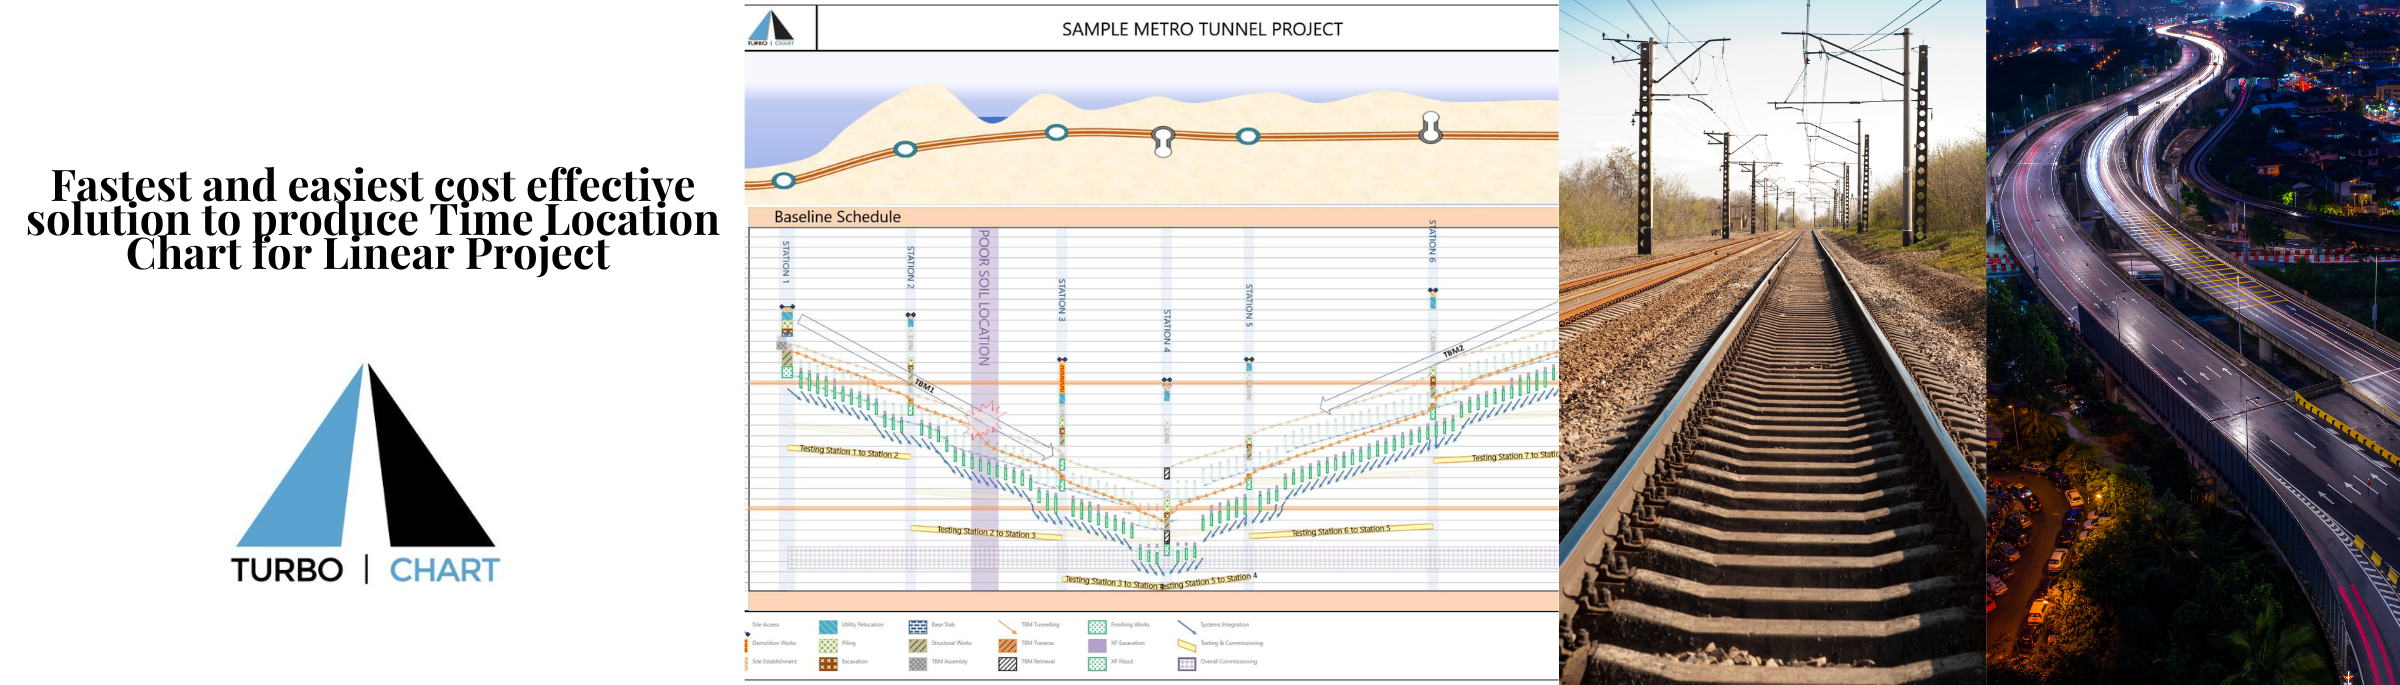
THE EASIEST AND FASTEST WAY TO CREATE TIME LOCATION CHARTS FOR LINEAR PROJECTS
Turbo Chart is a software that helps manage construction projects easily and affordably. It has all the features you need to track progress, generate reports and create Time Location Charts quickly. It can work with different project scheduling data and specializes in producing Time Location Charts, which are diagrams that show all activities along a construction site in one chart. Turbo Chart makes this process simple and easy to understand.
Turbo Chart is a software tool that simplifies the management of linear infrastructure and construction projects. It produces Time Location Charts that show the sequence and timing of operations at different locations, making it easier to identify conflicts and make decisions. It integrates location information into project schedules, making them more compact and readable. Turbo Chart works with Primavera P6 and MSP, eliminating the need for double data entry. It can also be used for vertical building projects by using the relative levels between floors as location values. With Turbo Chart, managing construction projects has become simpler and more effective.
Designed to work with your existing project schedule data
Primavera P6
Microsoft Project
Asta PowerProject
Safran Project/Risk
Any Spreadsheet ready data
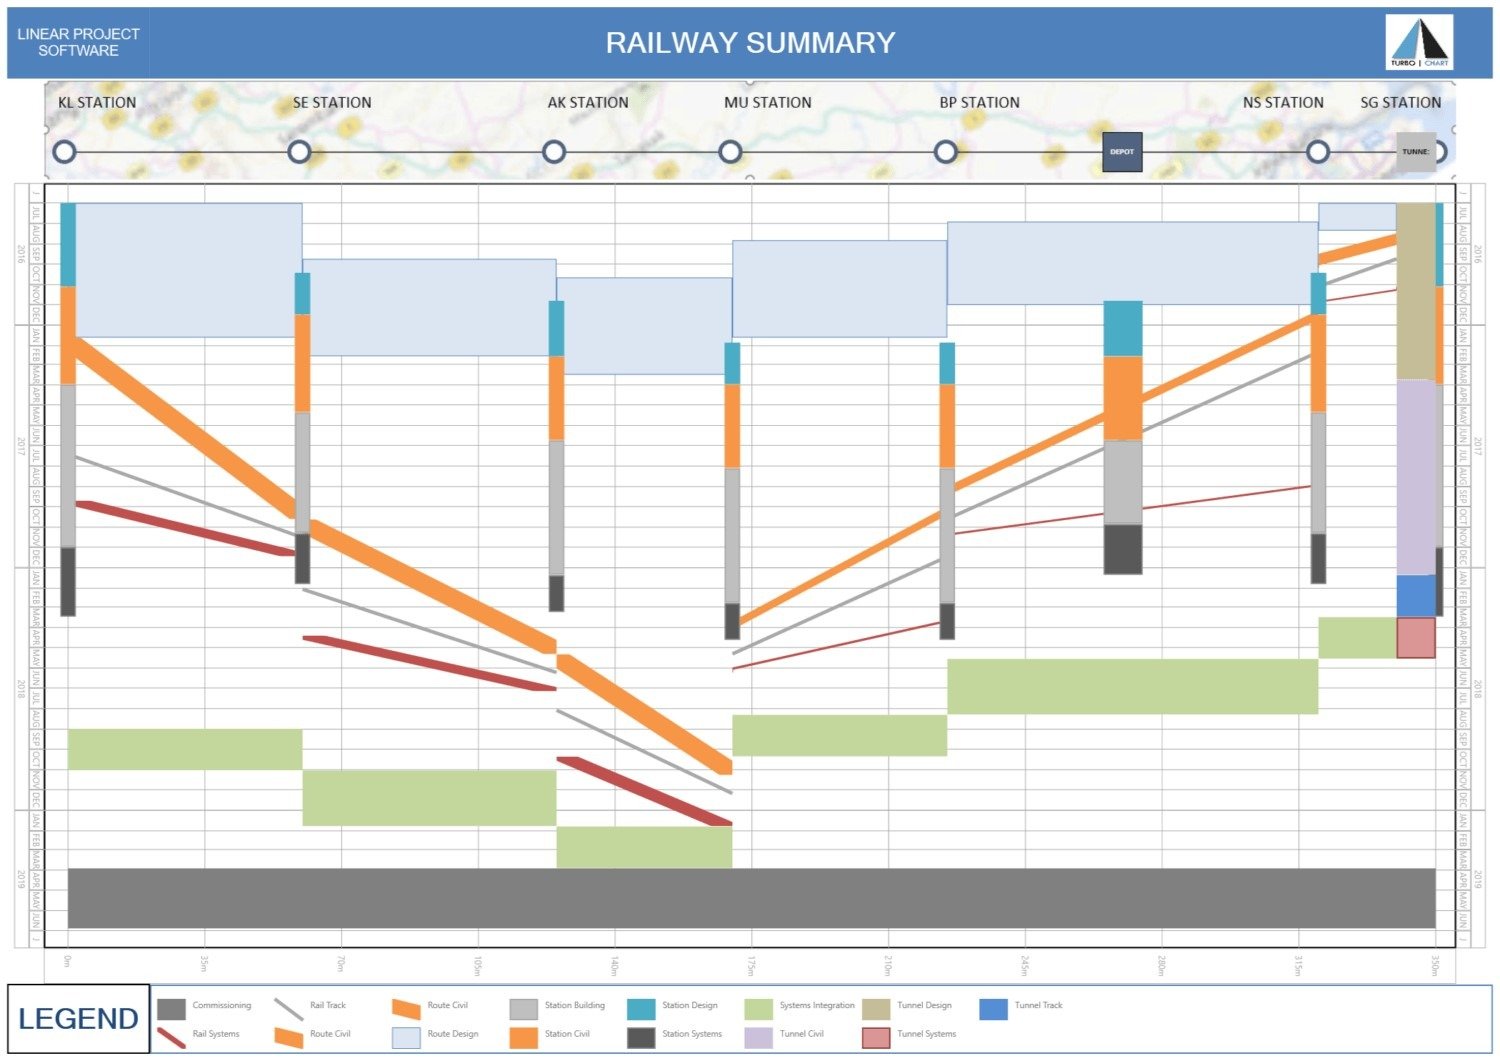
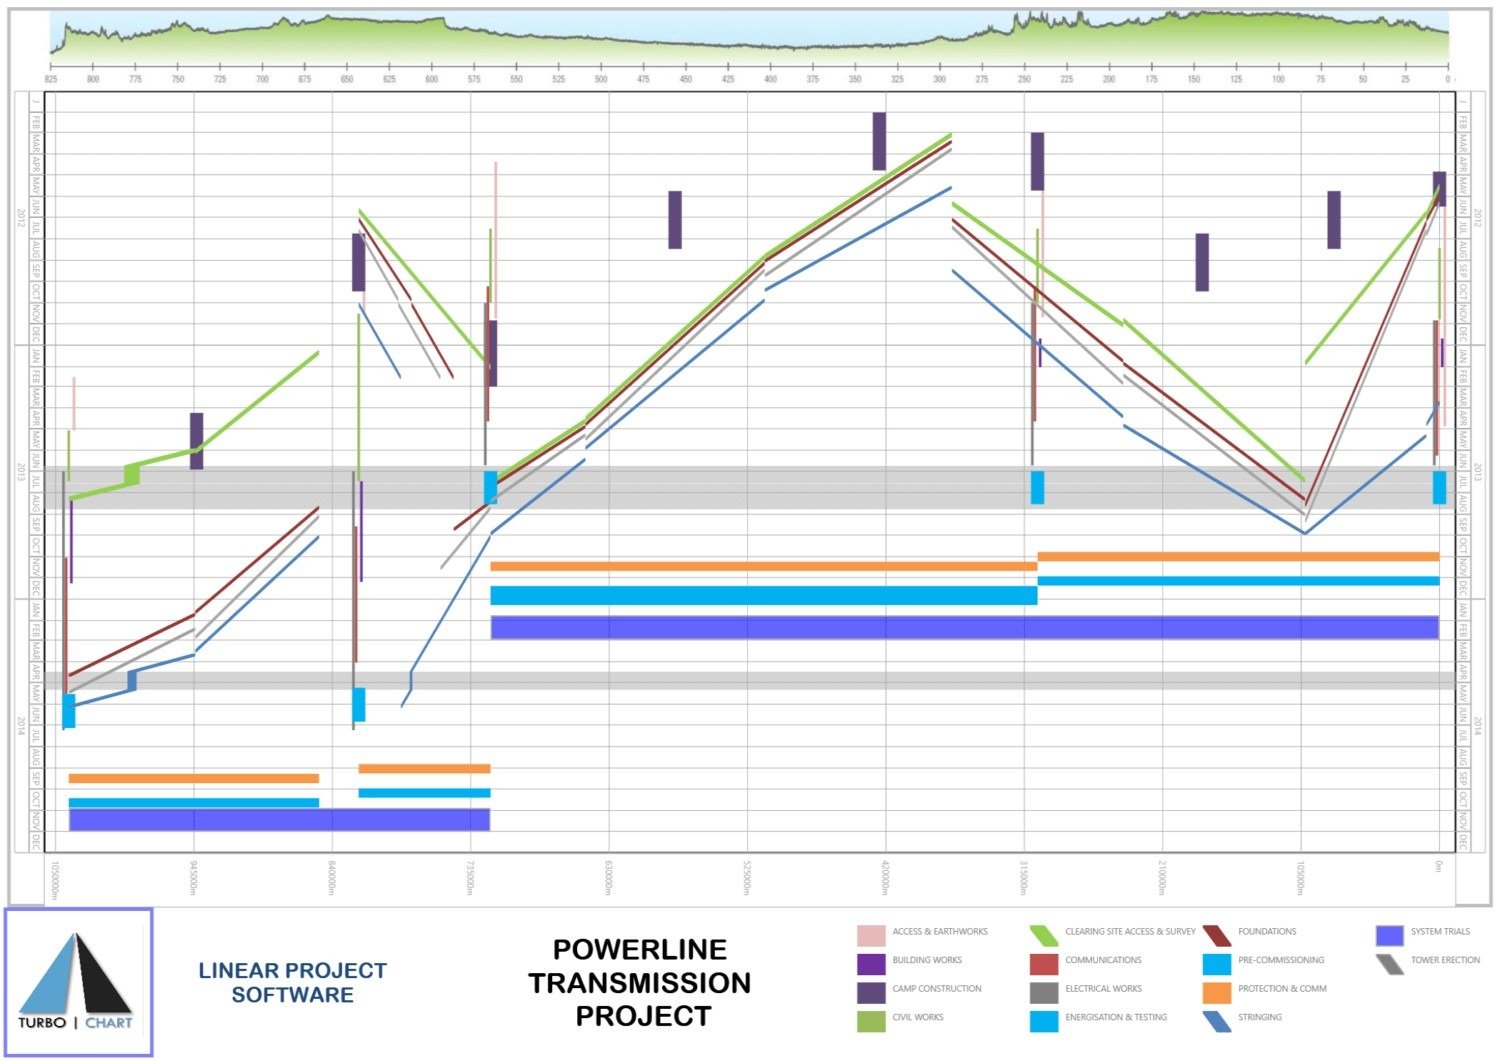
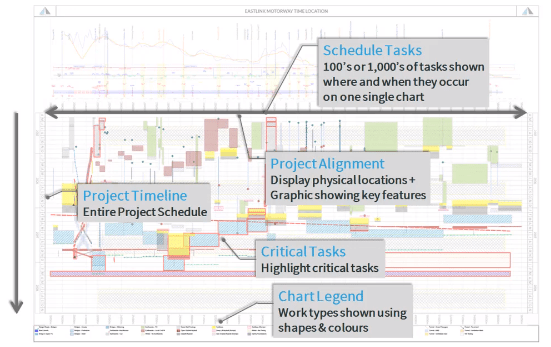
A time–distance chart is generally a diagram with one axis representing time and the other axis distance. The advantage of a time–distance diagram is that it nicely shows all visible activities along the construction site on a single diagram. In project management, a time–distance diagram (other names: Time-chainage diagram, Time–distance chart, Time-chainage chart, Time–location diagram, Time-location chart, March chart, Location–time chart, Orthogonal Diagram, Line of balance chart, Linear Schedule or Horse Blanket Diagram), is a method of graphically presenting a time schedule for all types of longitudinal projects such as pipeline, rail, bridge, tunnel, road, and transmission line construction.
Download Turbo-Chart and trial for 14 days for free
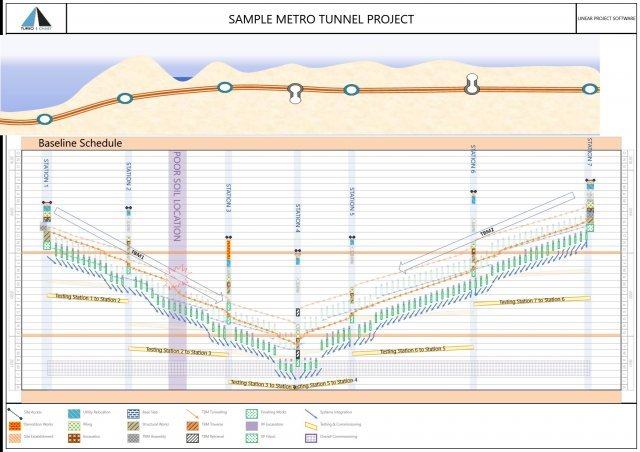
Sample Chart
The Time Location diagram shows both the optimal sequence of operations at the same location, but also which operations take place at the same time in other locations. Conflicts become visible through overlapping lines and areas.
Traditional CPM schedules and network diagrams are quite detailed, but they fail to provide a visual connection between the Project plan and the Project itself. By the addition of location information, Turbo Chart adds an extra dimension to your schedule, giving you more information than an equivalent Gantt chart. It easily converts a multi-page schedule in a more compact and readable form that can be used for effective tracking the project.
Turbo Chart is integrated with Primavera P6 software to enable schedule data to be transferred easily into Turbo Chart. Users do not have to create any data in Turbo Chart to avoid any double entry. Turbo Chart generates Time Location Charts quickly from existing Primavera P6 schedules allowing Turbo Chart to be used as an additional reporting tool alongside the Gantt chart generated by Primavera P6 or MSP.
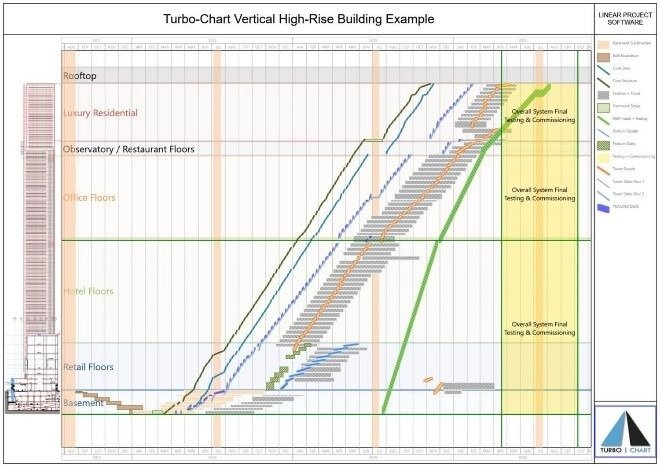
Turbo Chart can be applied to vertical building projects (High-rise building Project) just as easily as linear Infrastructure project schedules. By using the relative levels between floors as the location start and end values, and adding a discipline code, a time location chart representing the varying trades progressing across the vertical floors can be easily visualized from existing project schedules.